Mode of Grouped Data


Mode of Grouped Data
Mode Of Grouped Data:
It is possible that more than one value may have the same maximum frequency. In such situations, the data is said to be multimodal. Though grouped data can also be multimodal, we shall restrict ourselves to problems having a single mode only.
Example : The wickets taken by a bowler in 10 cricket matches are as follows:
2 6 4 5 0 2 1 3 2 3
Find the mode of the data.
Solution: Let us form the frequency distribution table of the given data as follows:
| Number of wickets | 0 | 1 | 2 | 3 | 4 | 5 | 6 |
| Number of matches | 1 | 1 | 3 | 2 | 1 | 1 | 1 |
Clearly , 2 is the number of wicktes taken by the bowler in the maximum number ( i.e, 3) of matches. So, the mode of this data is 2.
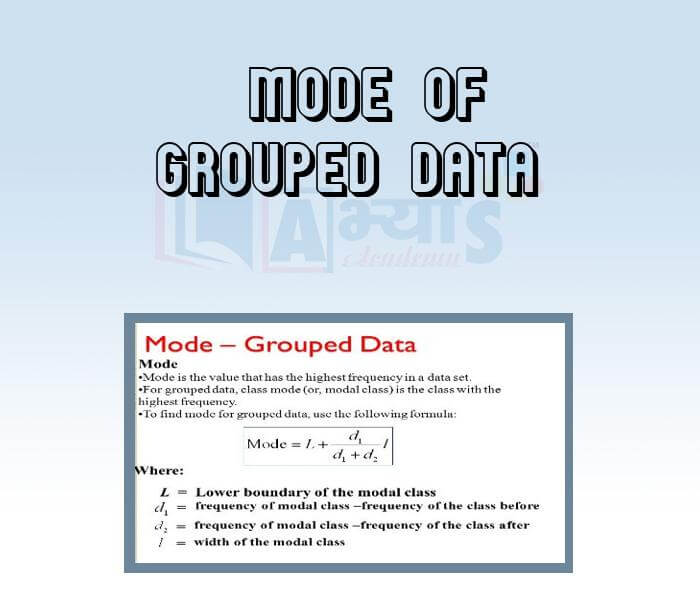
In a grouped frequency distribution, it is not possible to determine the mode by looking at the frequencies. Here, we can only locate a class with the maximum frequency, called the modal class. The mode is a vlaue inside the modal class, and is given by the formula:
where l = lower limit of the modal class,
h = size of the class interval ( assumibg all class sizes to be equal )
= frequency of the modal class,
= frequency of the class preceding the modal class,
= frequency of the class succeeding the modal class.
Let us consider the following examples to illustrate the use of this formula.
f
To find the mode of a grouped data, the size of the classes is ________________. | |||
| Right Option : A | |||
| View Explanation | |||
Students / Parents Reviews [10]
Abhyas Methodology is very good. It is based on according to student and each child manages accordingly to its properly. Methodology has improved the abilities of students to shine them in future.

Manish Kumar
10thAbout Abhyas metholodology the teachers are very nice and hardworking toward students.The Centre Head Mrs Anu Sethi is also a brilliant teacher.Abhyas has taught me how to overcome problems and has always taken my doubts and suppoeted me.

Shreya Shrivastava
8thAbhyas is a complete education Institute. Here extreme care is taken by teacher with the help of regular exam. Extra classes also conducted by the institute, if the student is weak.

Om Umang
10thIt was good as the experience because as we had come here we had been improved in a such envirnment created here.Extra is taught which is beneficial for future.

Eshan Arora
8thMy experience with Abhyas academy is very good. I did not think that my every subject coming here will be so strong. The main thing is that the online tests had made me learn here more things.

Hiya Gupta
8thMy experience with Abhyas is very good. I have learnt many things here like vedic maths and reasoning also. Teachers here first take our doubts and then there are assignments to verify our weak points.

Shivam Rana
7thIt was a good experience with Abhyas Academy. I even faced problems in starting but slowly and steadily overcomed. Especially reasoning classes helped me a lot.

Cheshta
10thIt has a great methodology. Students here can get analysis to their test quickly.We can learn easily through PPTs and the testing methods are good. We know that where we have to practice

Barkha Arora
10thMy experience was very good with Abhyas academy. I am studying here from 6th class and I am satisfied by its results in my life. I improved a lot here ahead of school syllabus.

Ayan Ghosh
8thOne of the best institutes to develope a child interest in studies.Provides SST and English knowledge also unlike other institutes. Teachers are co operative and friendly online tests andPPT develope practical knowledge also.